“Let us therefore animate and encourage each other, and shew the whole world, that a Freeman contending for Liberty on his own ground is superior to any slavish mercenary on earth.”
― George Washington
It is amazing watching the aftermath of Britain’s vote to leave the European Union. One thing which has struck me is the surprise on some people’s parts as to a group of people wanting to be distinct, independent, and separate from the larger group. This just seems a little ironic when you look back on all of human history with this same scenario occurring over and over again. Whether its the Roman, Greek, Babylonian, Austro-Hungarian, or any of the other countless empires that have attempted bring together people into one group, there has always been a tendency of groups to want to remain distinct. The same can be seen in modern countries such as Czechoslovakia, Afghanistan, or Iraq which were not formed directly through conquest. For a nation to remain unified, it must share some sort of uniting cultural commonality.
The cultural glue may be ideals, language, values, or religion held in common, but there must be something which holds people together or the groups within the larger group who do share some of these things will begin to come together and eventually desire to self-direct their own future. Personally, I think this tendency of people will occur in spite of all of the positive economic or standard of living benefits of remaining in their current unified state. In the case of the United States, in my opinion, it was always a belief in freedom of the individual, agreement on the fundamental principles of our democratic republic as outlined in the Constitution and Declaration of Independence, and agreement on the need for all of us to respect the rule of law governing disagreements we might have with one another. I would argue that this has always allowed us to overcome the tendency to want to break apart and divide on the basis of our differing cultural and religious beliefs. We all shared the common idea that freedom of the individual is of the utmost importance and our form of democratic limited government protected that freedom from others, both within and without, imposing their will upon us as individuals.
The big question, I suppose, for our future is whether we will keep these common beliefs which bind our country together as a unit. If we do not agree upon such overriding ideals which can hold us together, the various differences which have always been present in our country will inevitably weaken us to some degree or another. Our country has always been unique and strong because of our ability to take various peoples from various differing backgrounds and come together because of our love for the beliefs that make the United States a united country based not upon common ethnicity or race, but upon common ideals. I sincerely hope we all do our best to make sure this is always the case for ourselves and future generations by recommitting to these ideals and emphasizing them to our young people as being the glue which has been able to hold us together thus far.
-Clint Stroupe
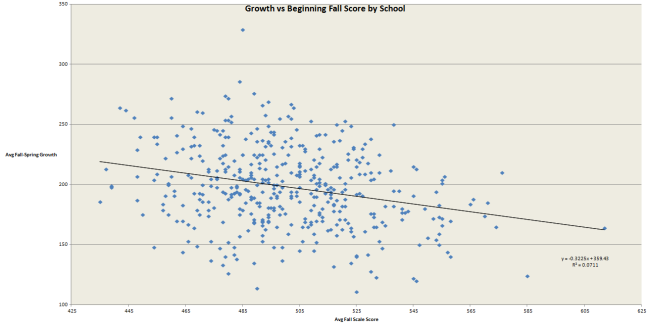 The graph shows a comparison of the average beginning 2015 Fall score for each school (x-axis) compared to the average gains in scale score after the 2016 Spring assessment (y-axis). The correlation is not very strong overall, but you can visibly see the negative trend that with higher average beginning Fall scale scores the likelihood of being in the top rankings of growth after the ending Spring assessment goes trends downward. As stated this negative correlation is not very strong overall, but it is a correlation. More importantly, notice those schools on the upper end (545 and above average Fall score), none of those schools managed to go above 215 points of average growth (scale score gains). I am not a statistician, so this is far from scientific. However, I think it points to the strong possibility of the “ceiling” effect to which I am referring and should be kept in mind when examining growth at the individual schools and districts.